03
FUBAS 2.0 / Digital product
Data-rich by nature. Clear by design.
Team data, line-ups, live events and statistics compete for attention. The work was to create hierarchy without removing the energy of match day.
My role UX/UI design & product communication from concept to delivery
Design focus Navigation, hierarchy, states & mobile readability
Outcome Complete UX/UI design for team, league and live-match views
Different tasks on the same small screen
Following a match, checking a team’s season and entering a live update are different tasks. FUBAS brings them together on mobile. I designed the complete UX/UI and handled the product communication, with particular attention to how people move between these views.
The work in context
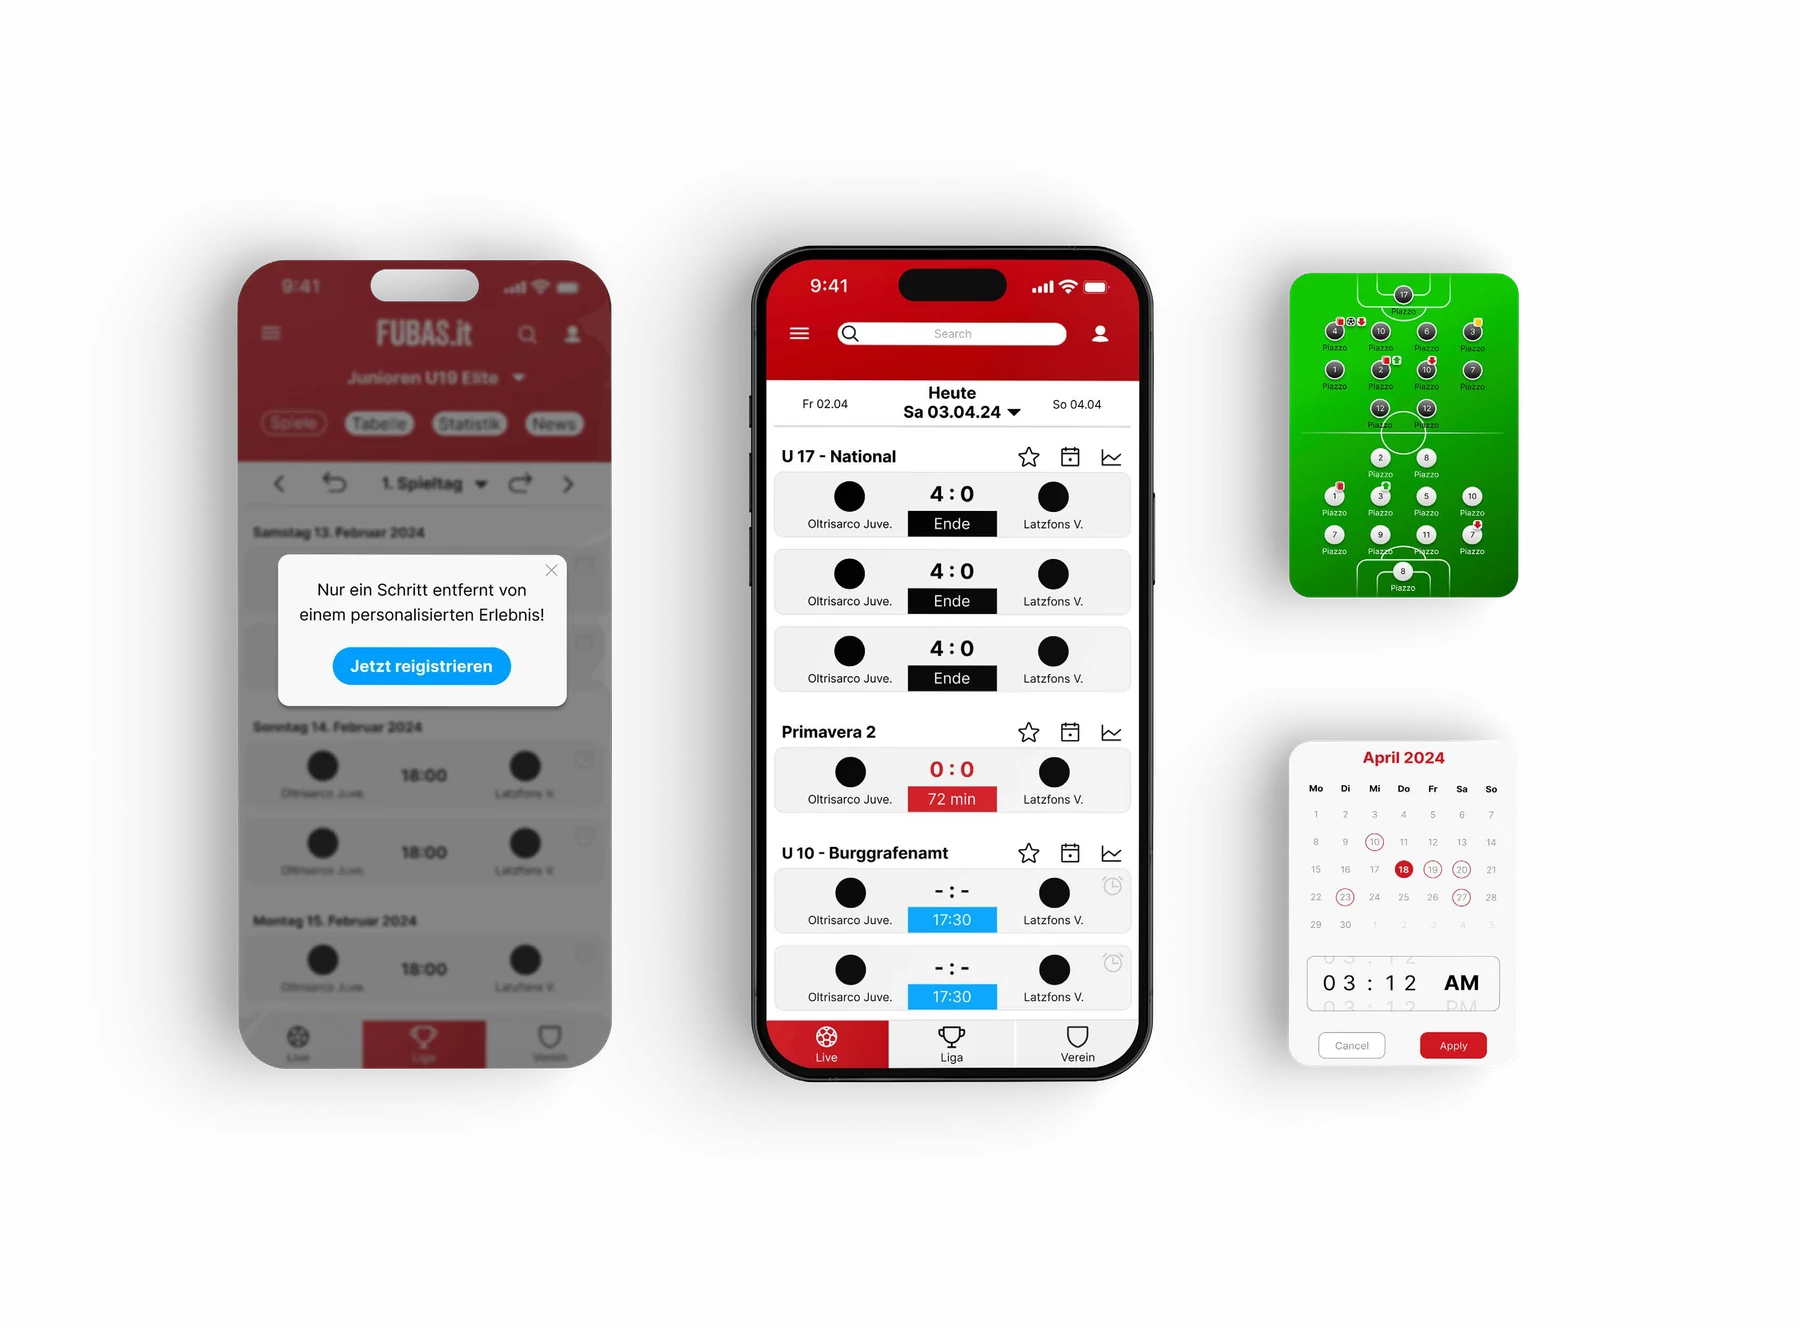
Give team data a clear order
The team view brings together the team identity, recent matches and current-season information. Summary cards highlight selected figures, while the season graph gives the league position a visual shape.
The design uses these different levels to separate a quick overview from the detail below it. The intention is to help people orient themselves before they start comparing statistics.
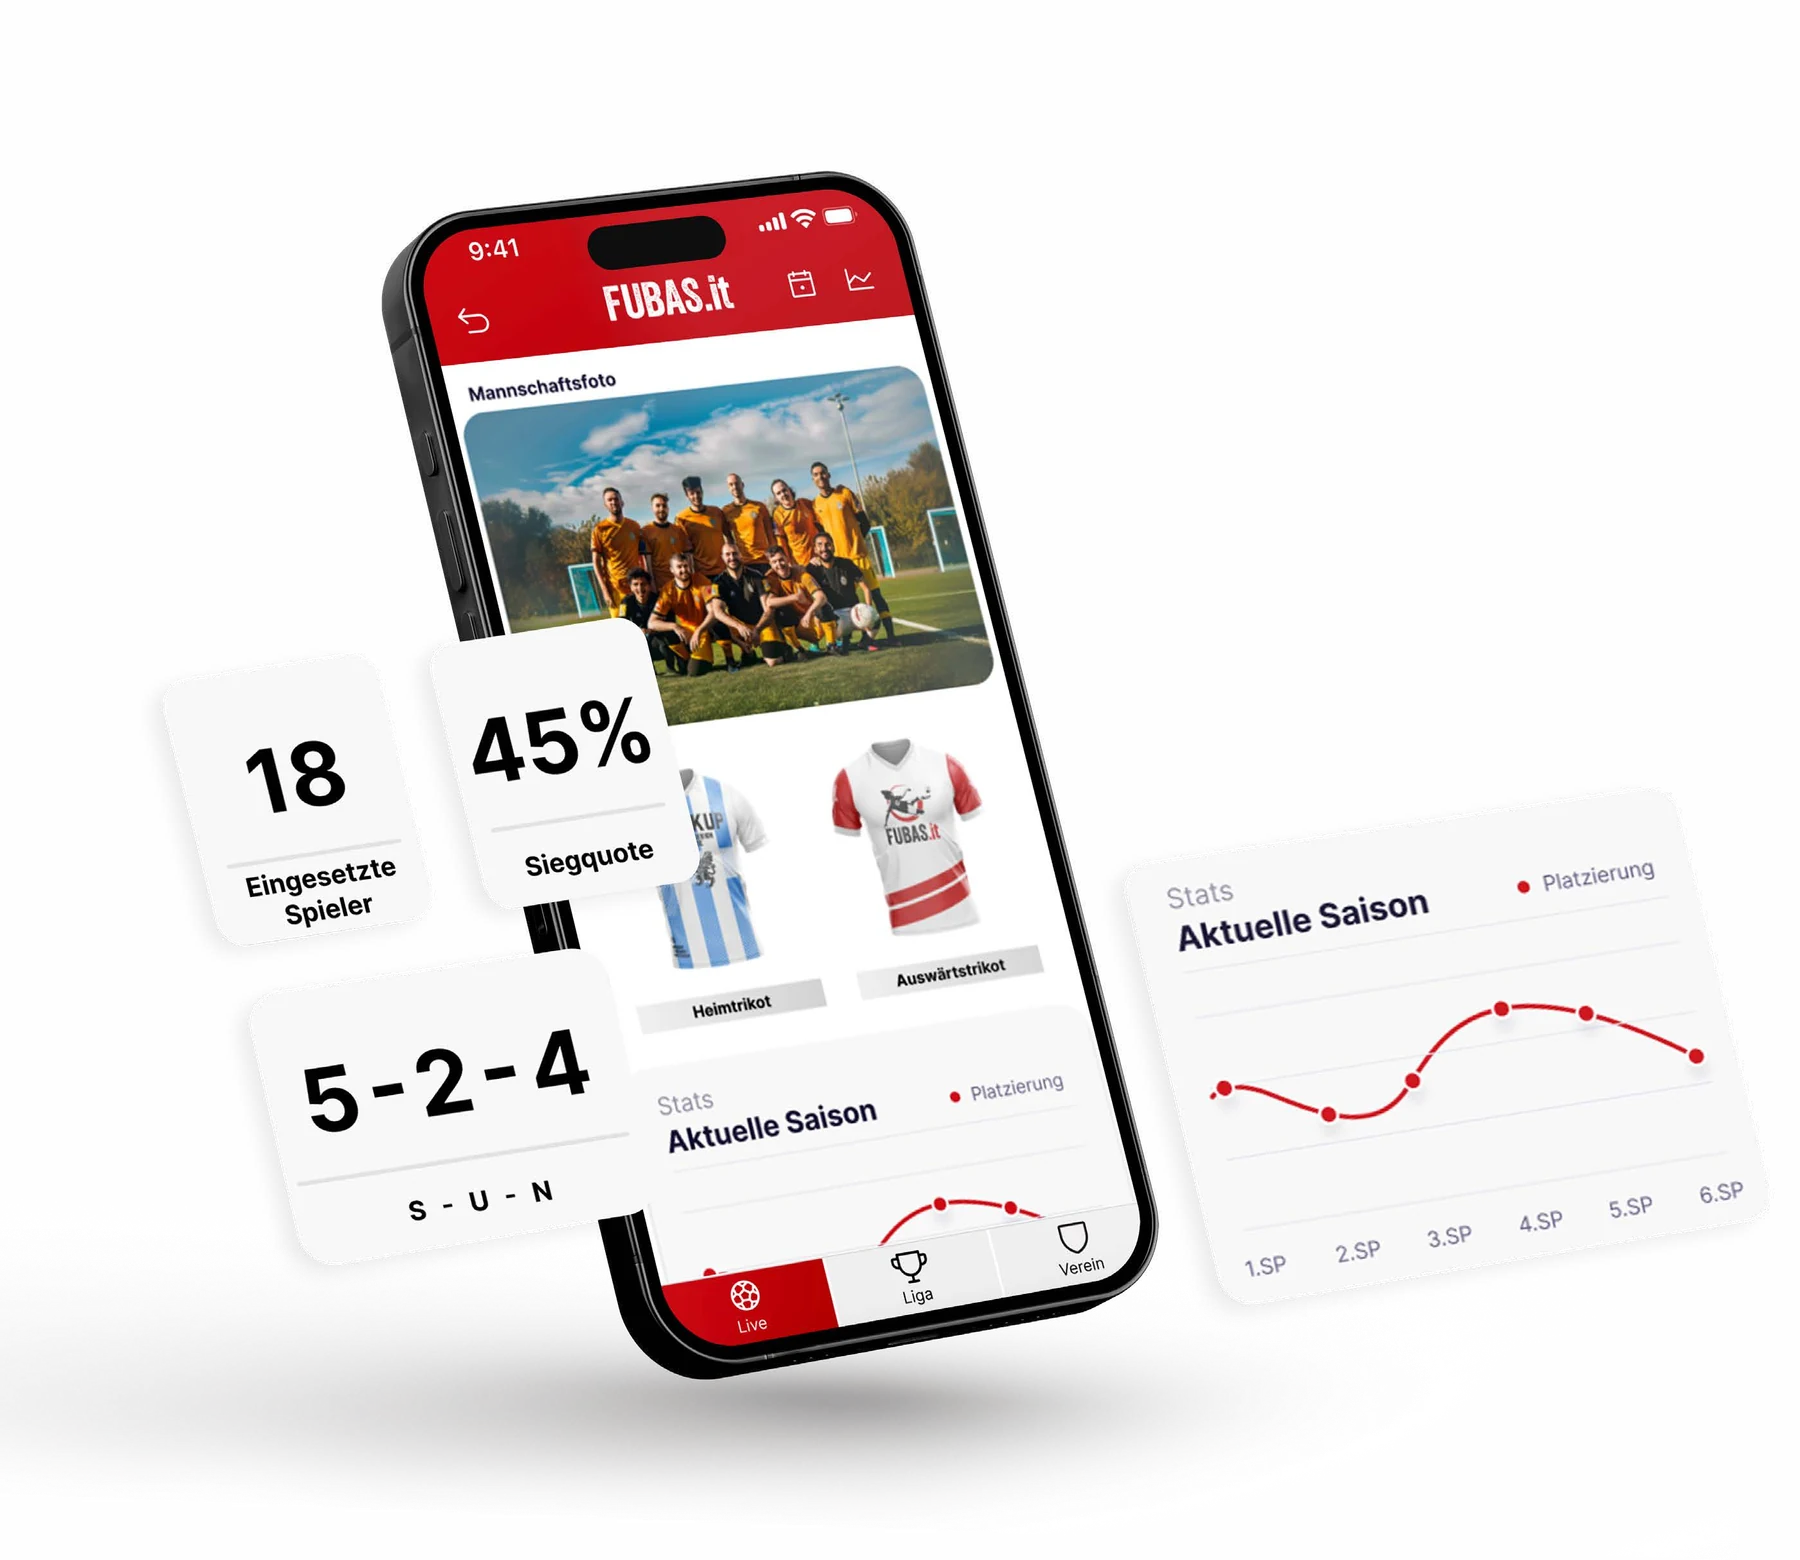
Separate browsing from reporting
The league views organize competitions, tables and team statistics. The reporter area serves a different purpose: managing a match and entering updates. Its controls have to make actions and match states explicit.
The selected screens show that distinction through navigation, grouped information and dedicated match actions. They are design examples, not a list of every feature currently available in the app.
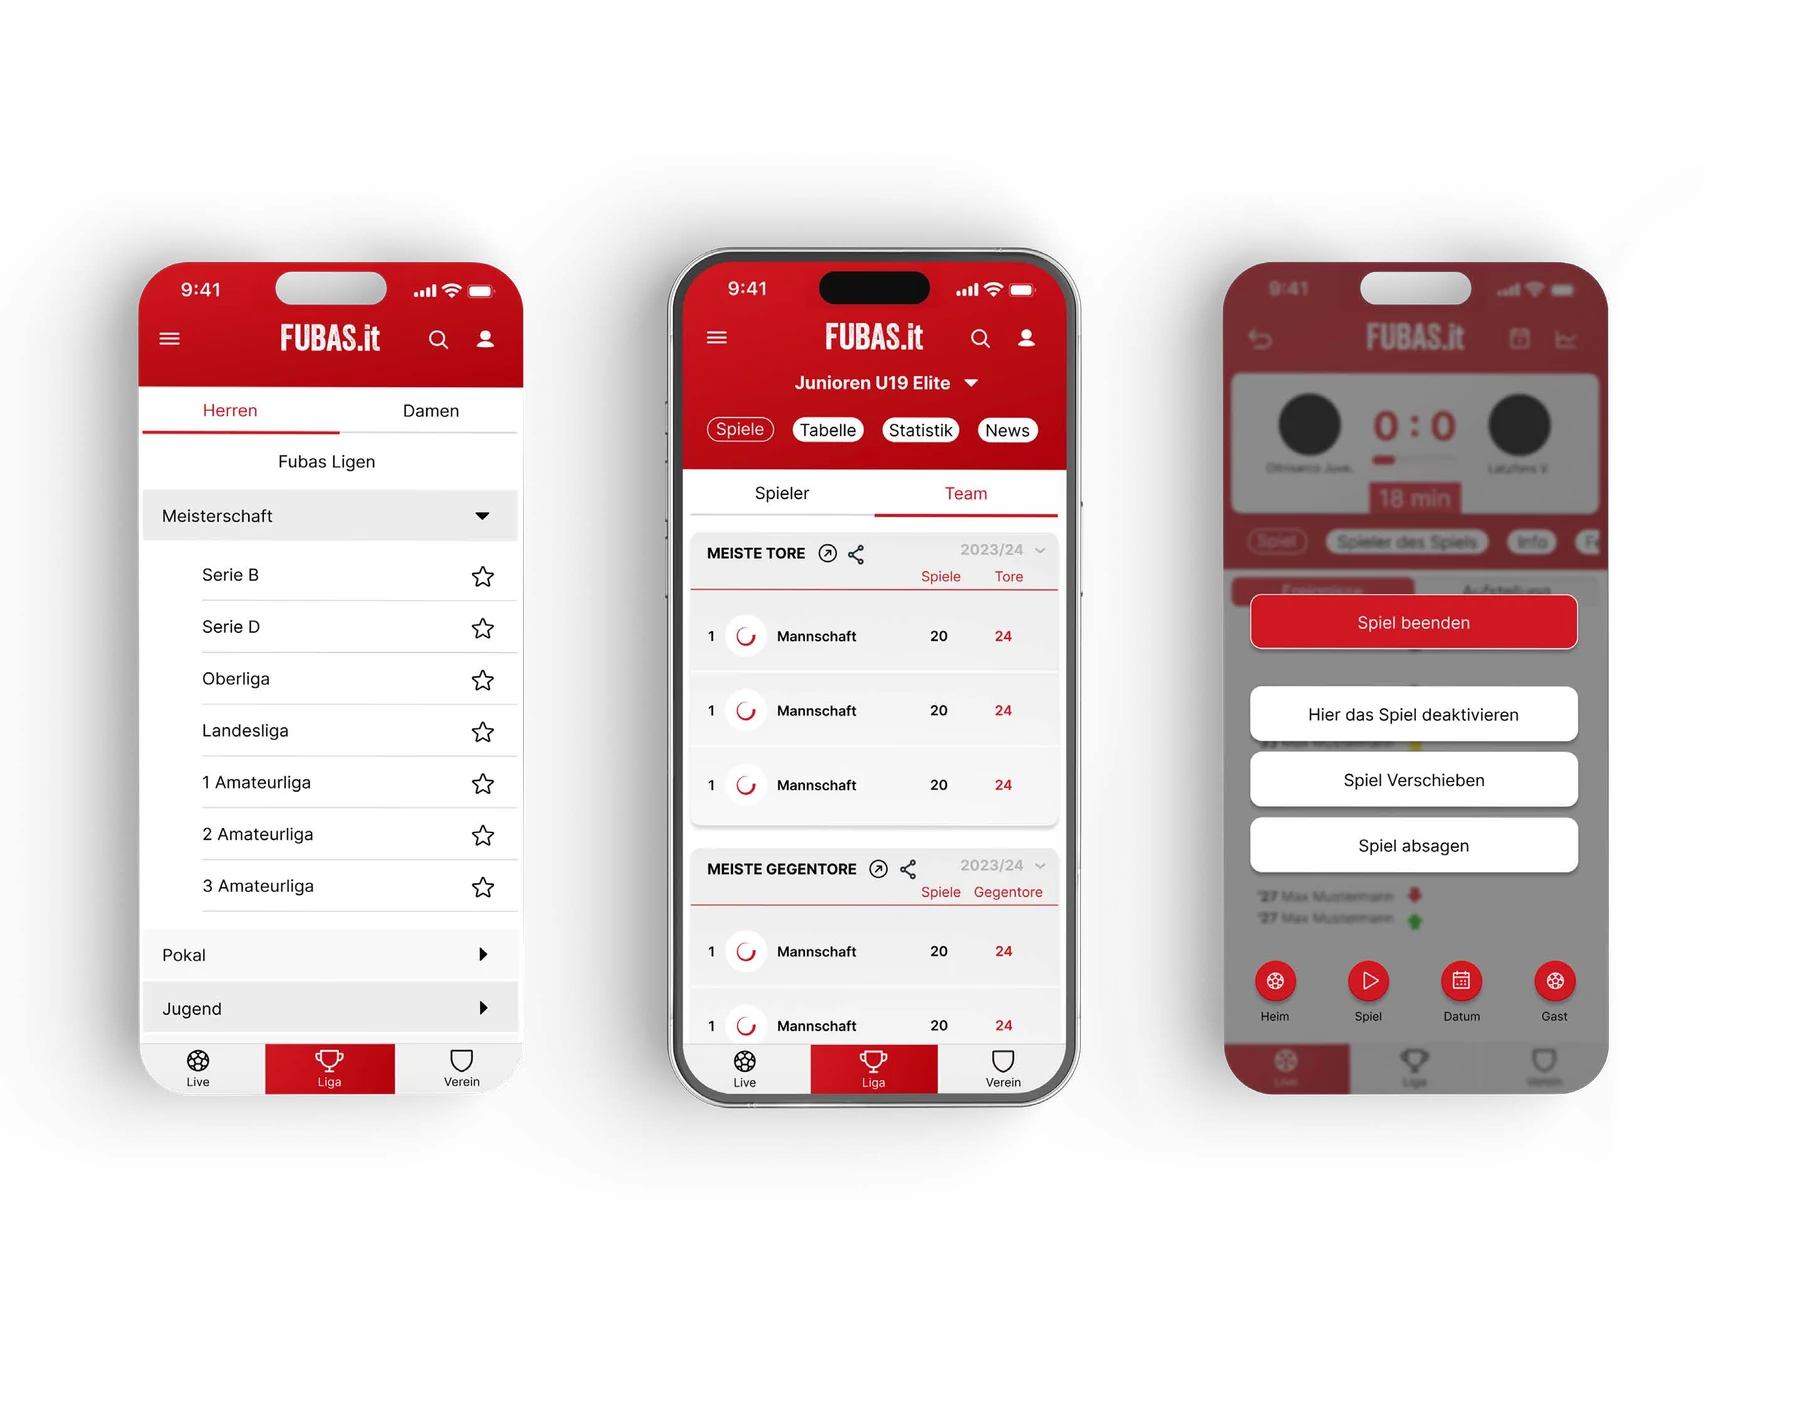
Make live events easy to distinguish
In the live view, score and match time stay separate from the sequence of events. Goals, cards and substitutions each carry their own visual cues, alongside the minute and player information.
This is where the interface has to balance density with readability. The designs keep the event types recognizable and the available controls in a consistent place.
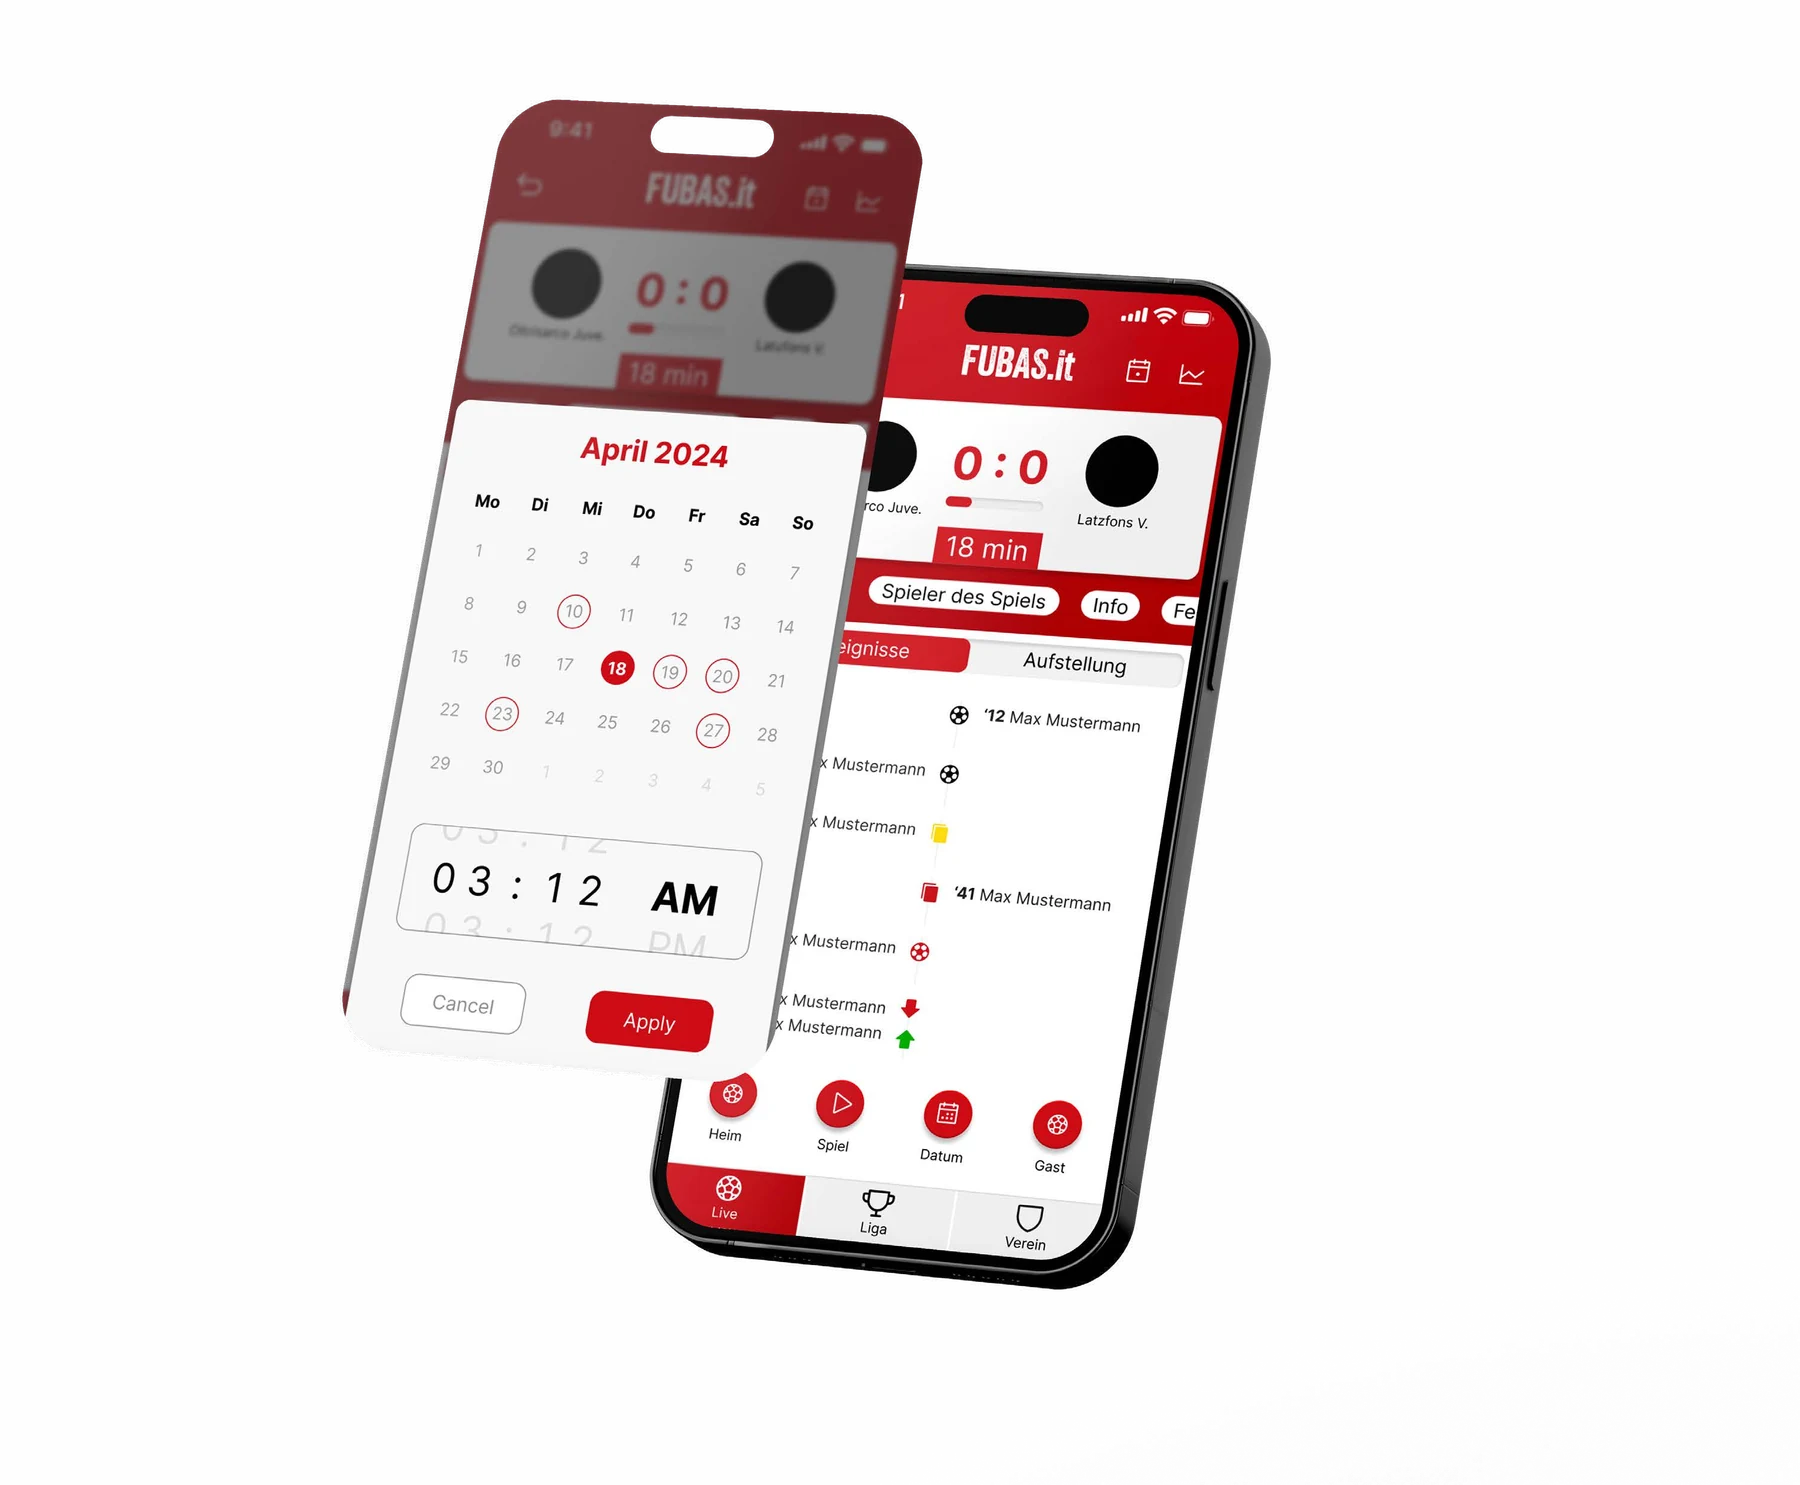
Beyond the selected mockups
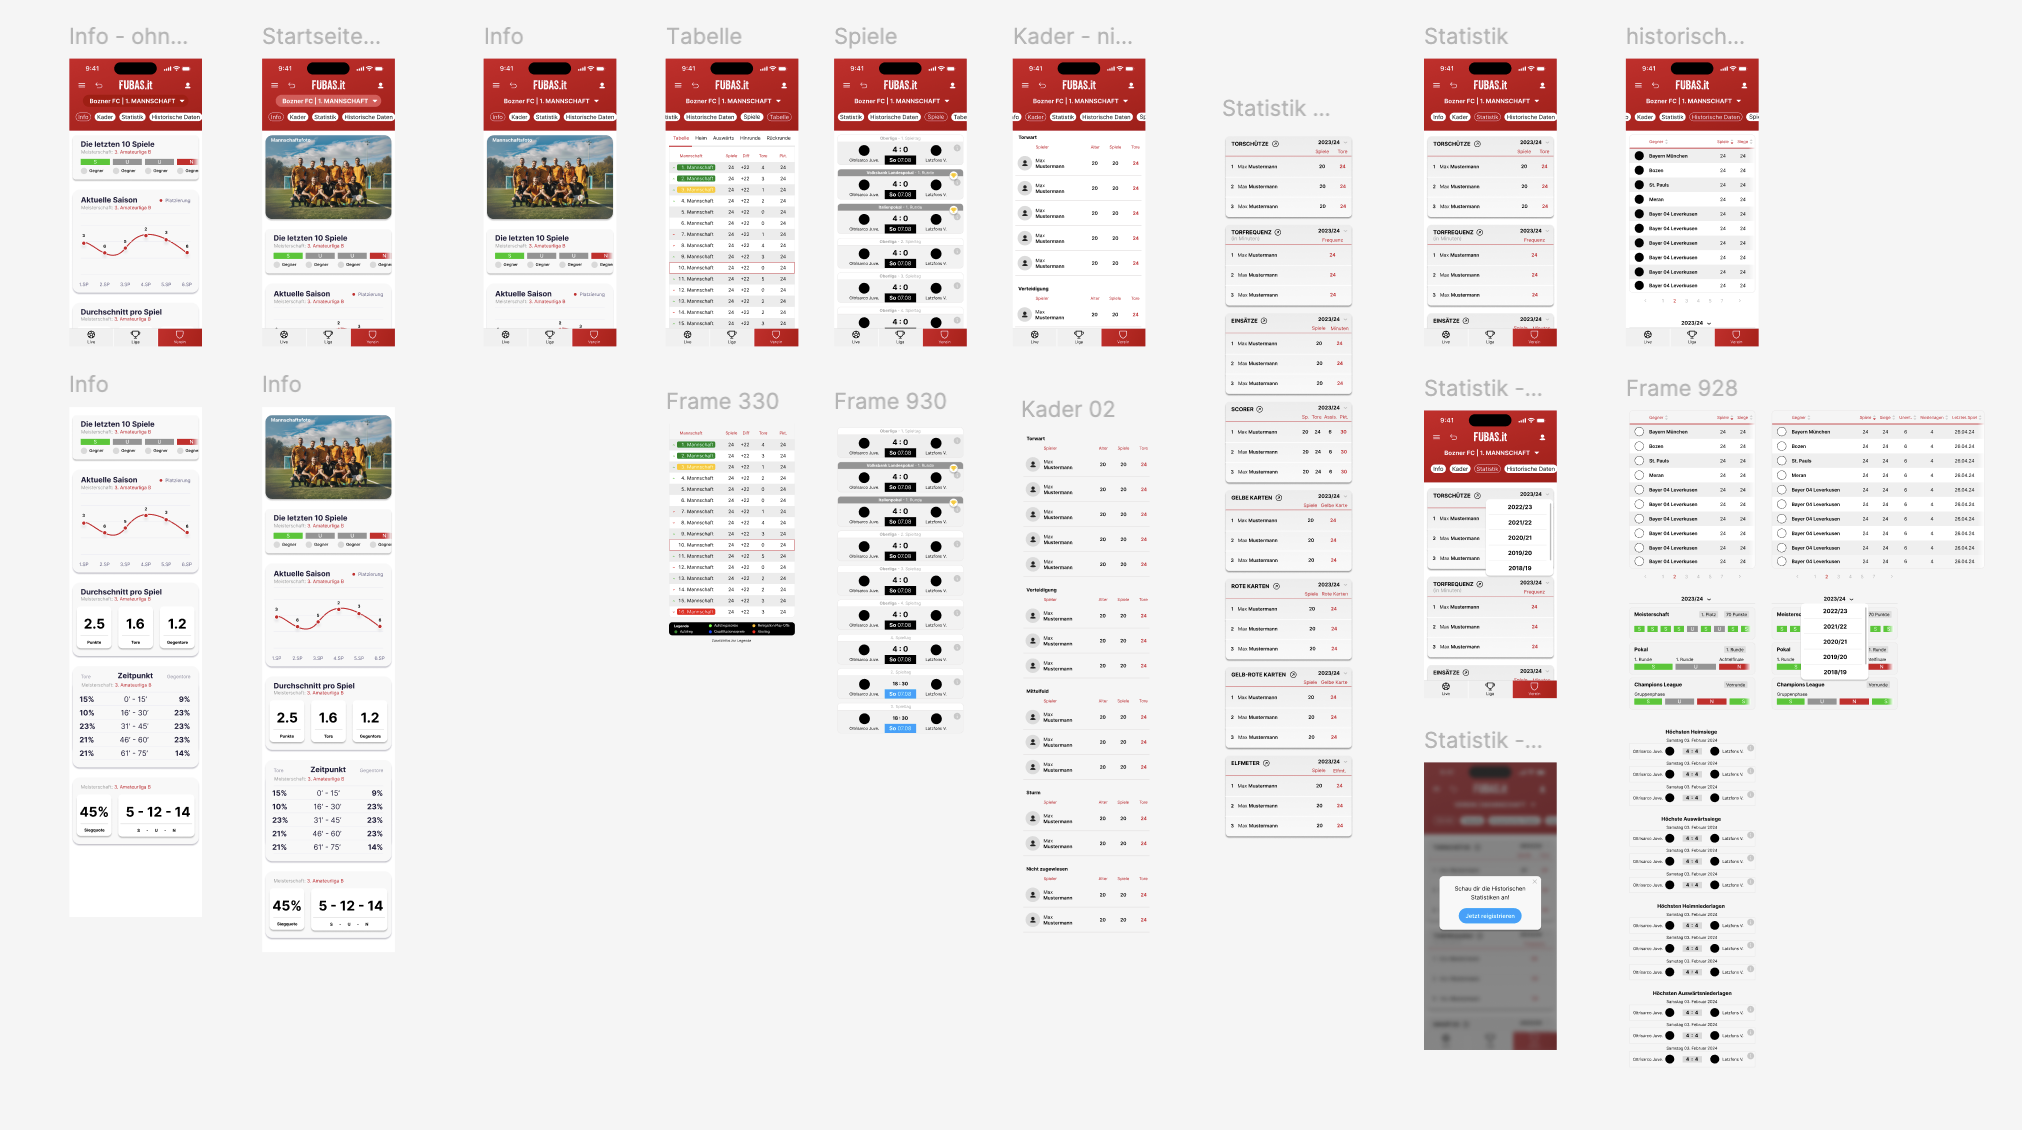
This wider view brings team information, squads, fixtures, tables and historical statistics together. It shows the range of screens and interface states behind the selected mockups, and how the same visual language carries across them.
The design output
A complete UX/UI design across navigation, team data, league statistics and live-match views, accompanied by product communication. Different tasks brought together through a consistent information hierarchy and interface language.
Open to collaboration
Complex briefs.Many moving parts.One clear direction.
I'm drawn to design challenges that make complex products and ideas feel simple, relevant and recognizable across every customer touchpoint.